Tutorials
Running Your First Segmentation Pipeline
A complete walkthrough from raw images to labeled masks in 2 steps.
Prerequisites
- Access to a Tapis-connected HPC system (Pitzer, Expanse, Ascend, or Cardinal)
- A Tapis account with a valid Slurm account to charge
- A directory of images on a Tapis filesystem
- (Optional) A Hugging Face token for gated models such as SAM3
Getting Started
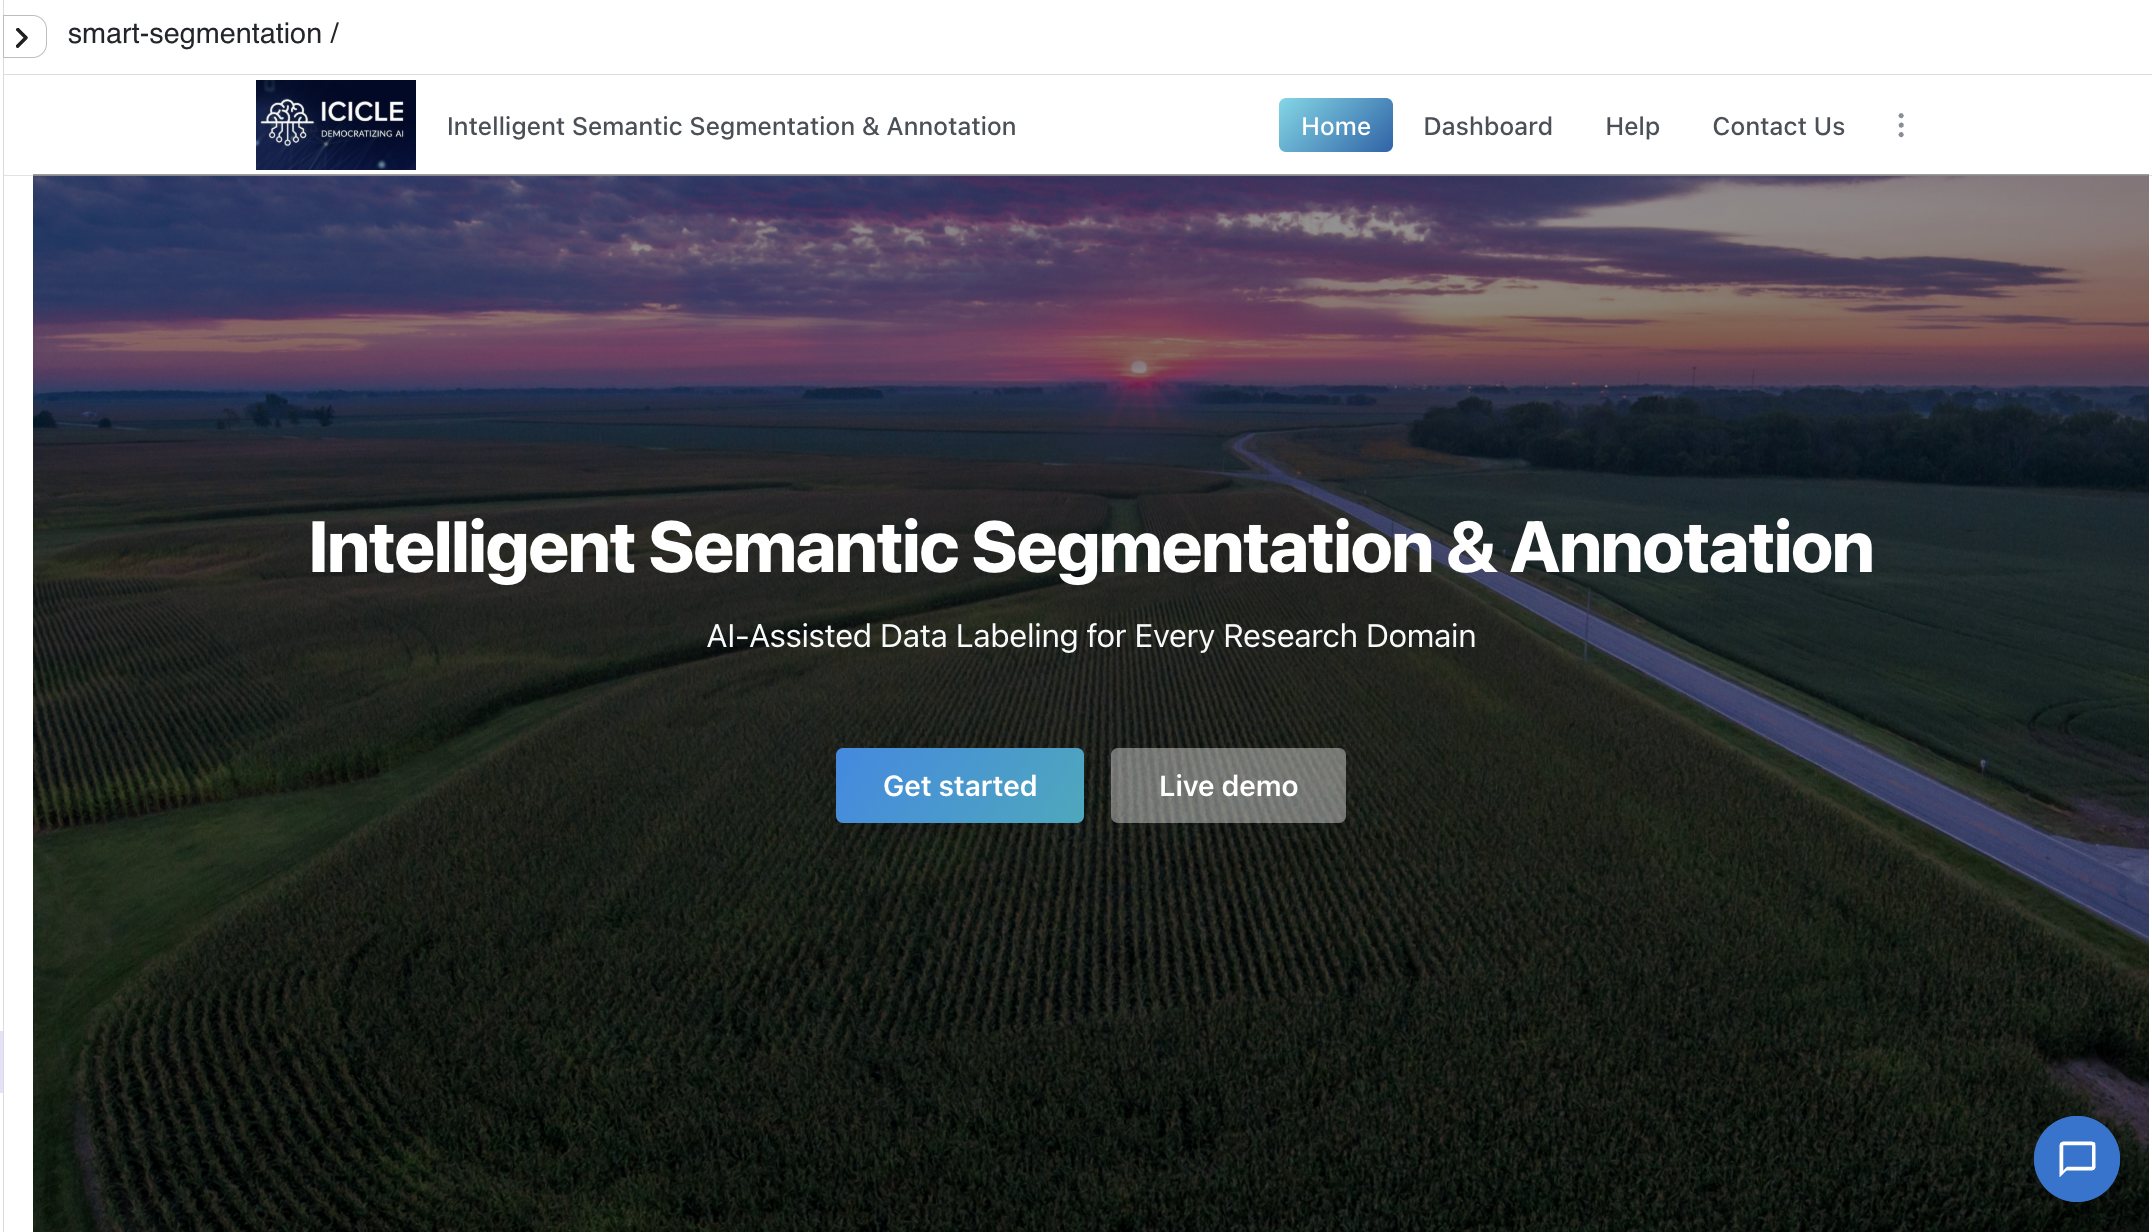
Navigate to the home page and click Get Started or Dashboard.
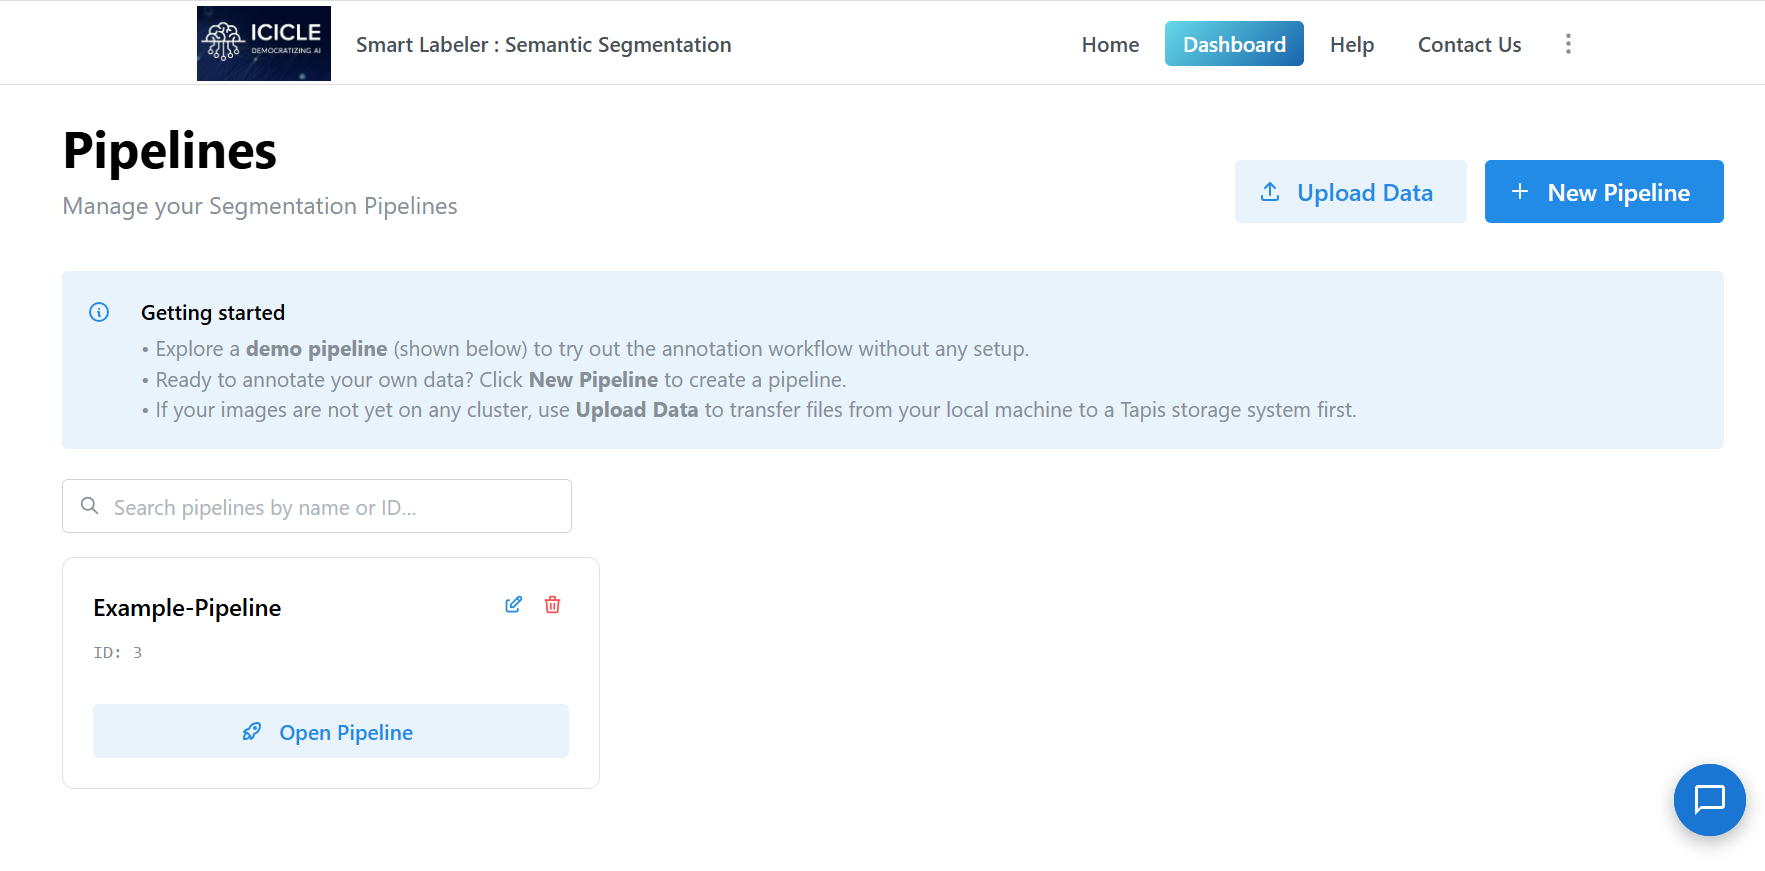
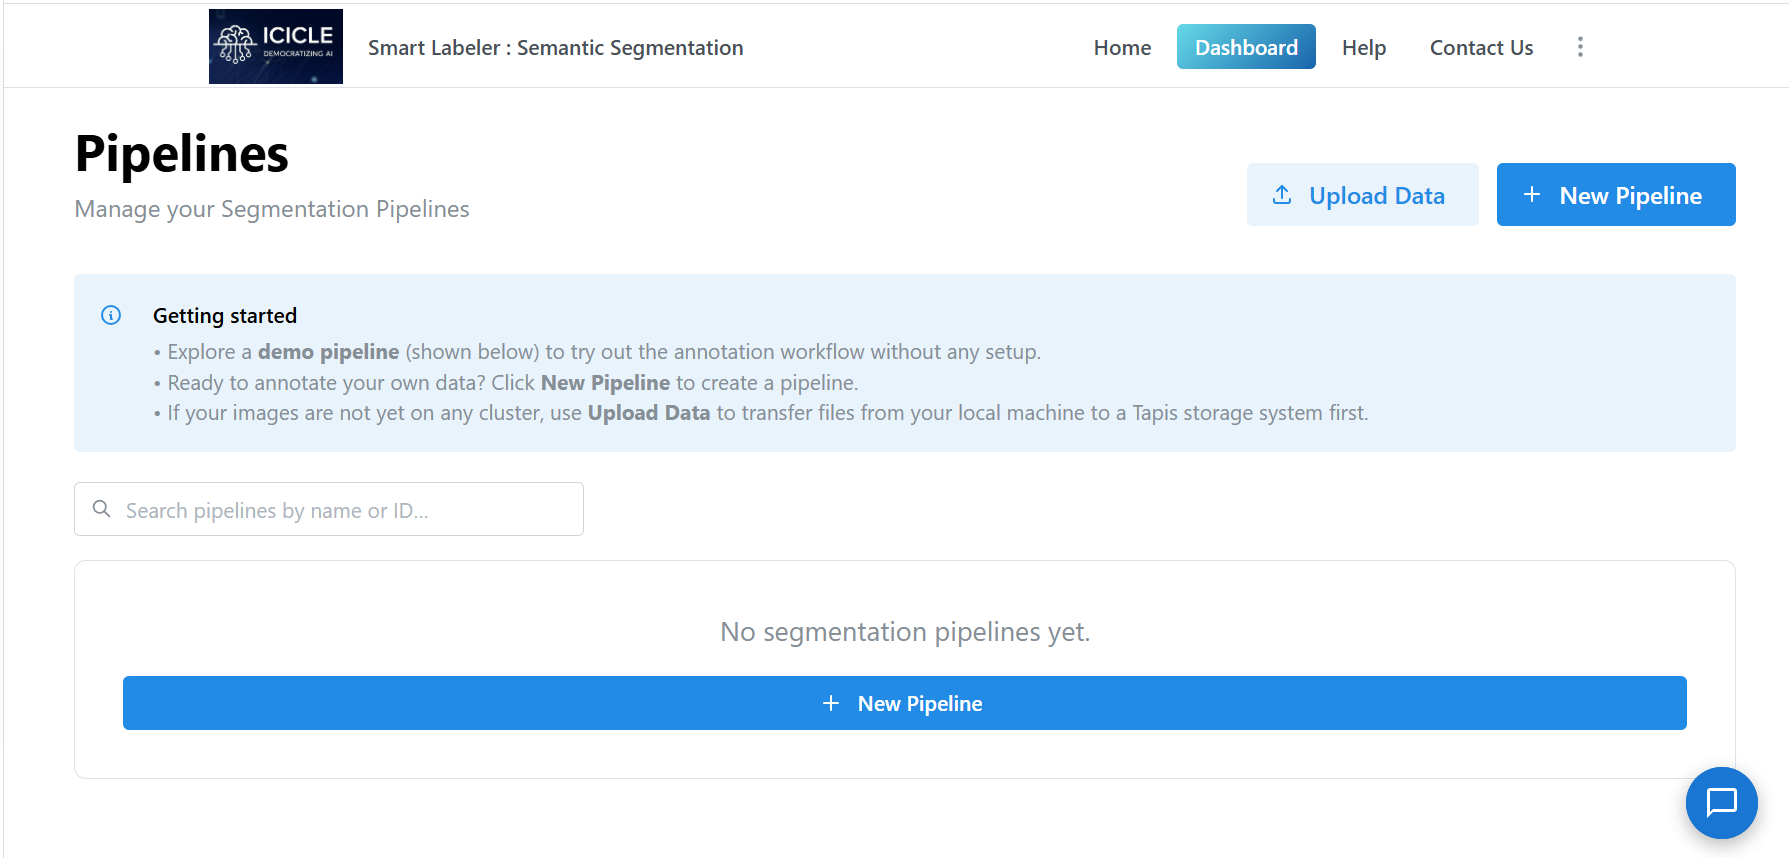
From the dashboard you can create a new segmentation pipeline or resume an existing one. Existing pipelines are listed with their unique ID and an Open Pipeline button. If no pipelines exist yet, a New Pipeline button appears in the center of the page.
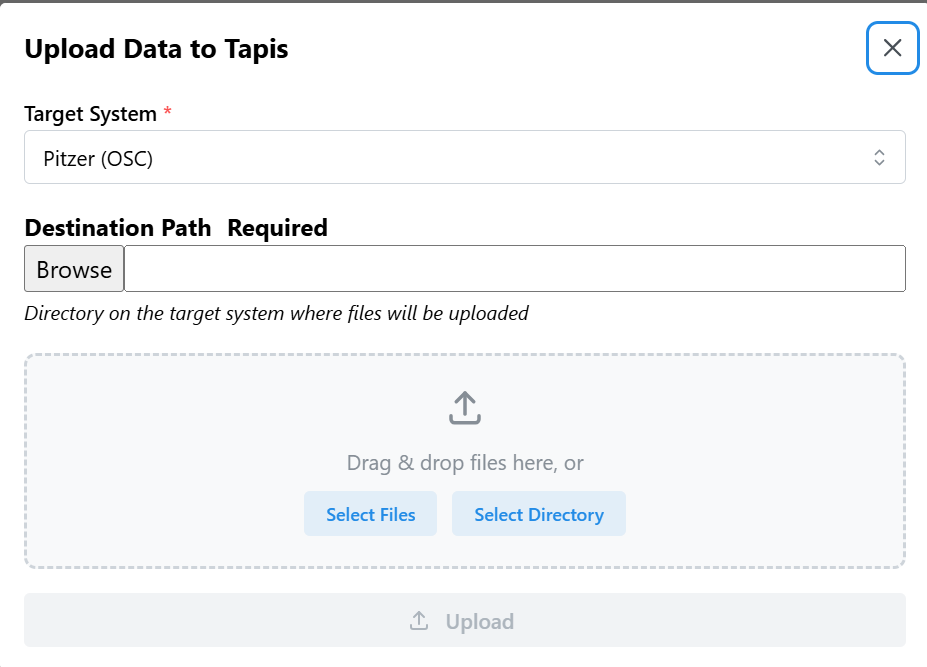
To upload images from your local machine to a Tapis storage system before starting, click Upload Data in the top-right corner of the dashboard.
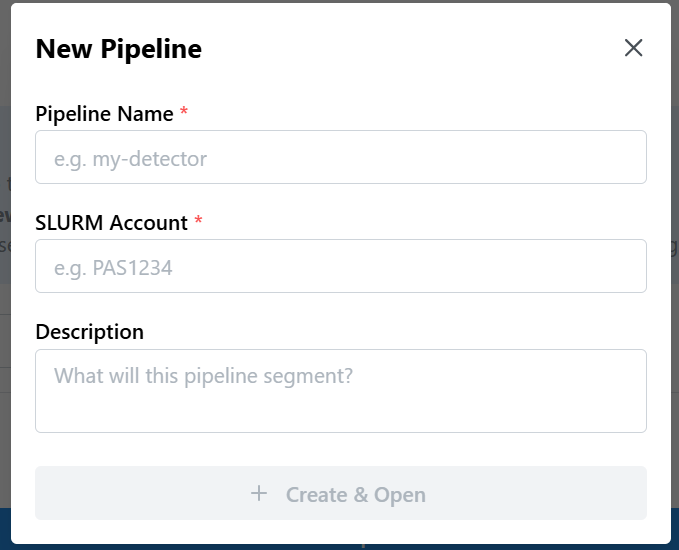
Click + New Pipeline to open the creation modal. Provide a Pipeline Name and a SLURM Account (required). An optional Description field is also available. Click Create & Open to initialize the workspace.
Step 1 — Project Setup & Data Upload
Remote Data Staging
If your images are not already on the cluster, upload them before launching the segmentation canvas. Click Upload Data from the dashboard to open the upload modal. Select a Target System (e.g. Pitzer (OSC)) and provide an absolute Destination Path on that system. Drag and drop files into the drop zone or use Select Files / Select Directory to browse locally, then click Upload.
Blank Pipeline & File Explorer
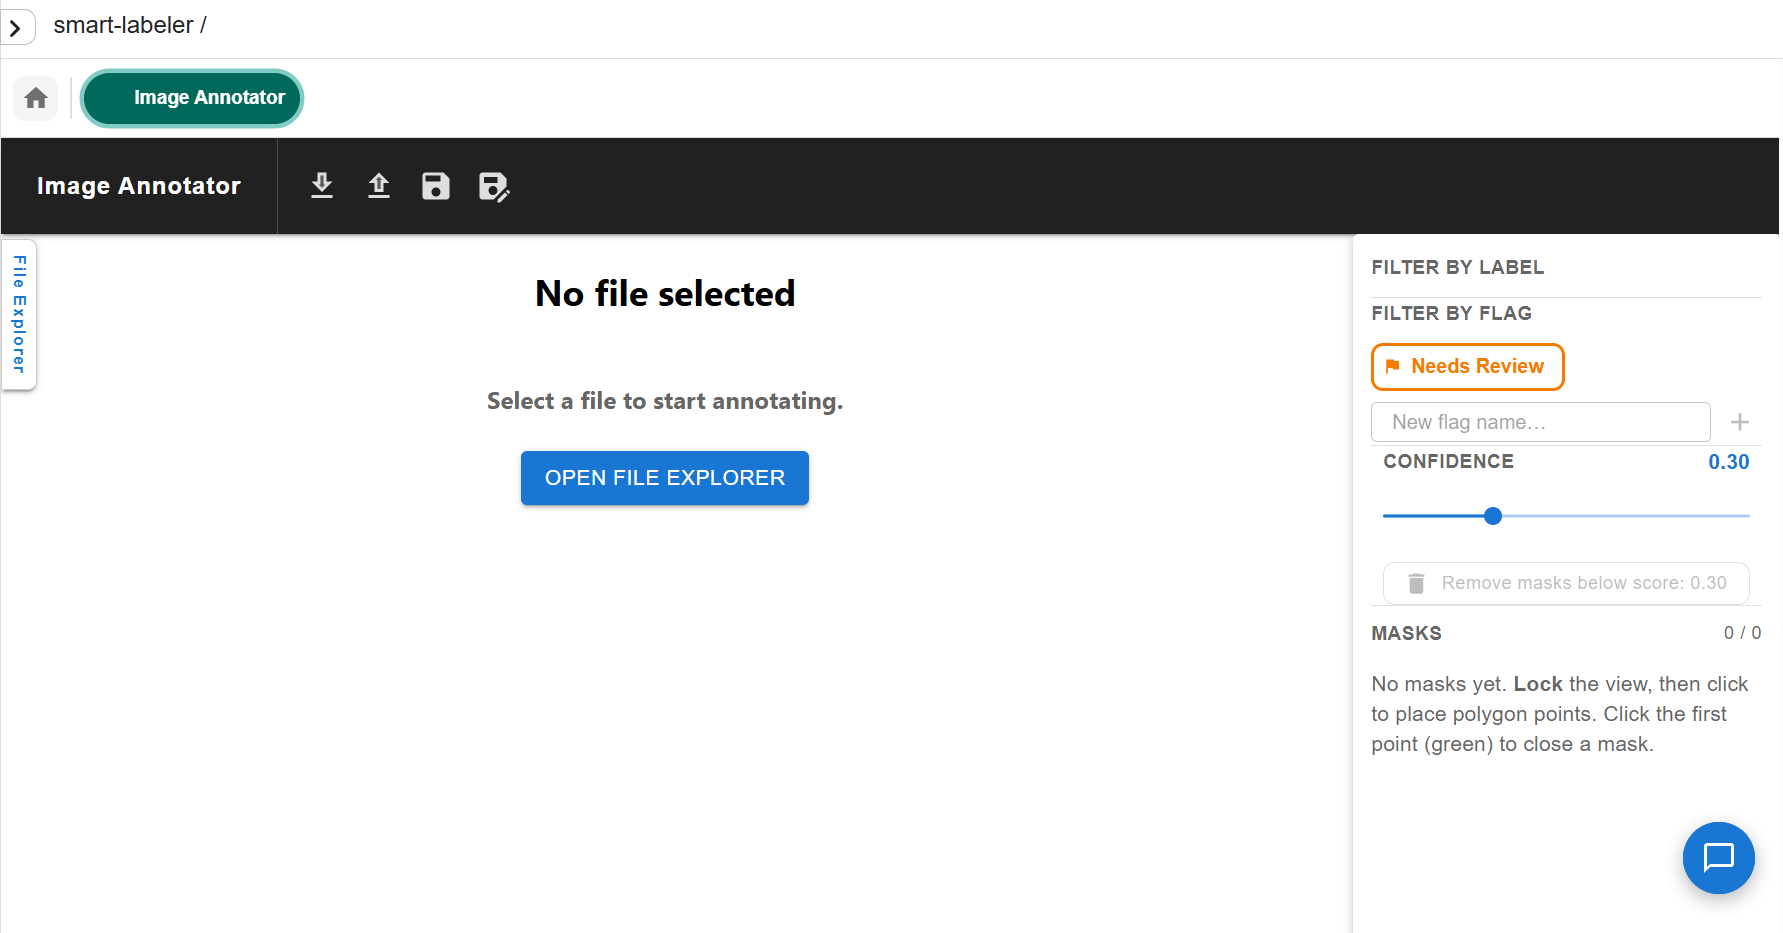
After creating a new pipeline, the Image Annotator canvas opens in a blank state. Click Open File Explorer (or the File Explorer tab on the left edge) to open the slide-out panel.
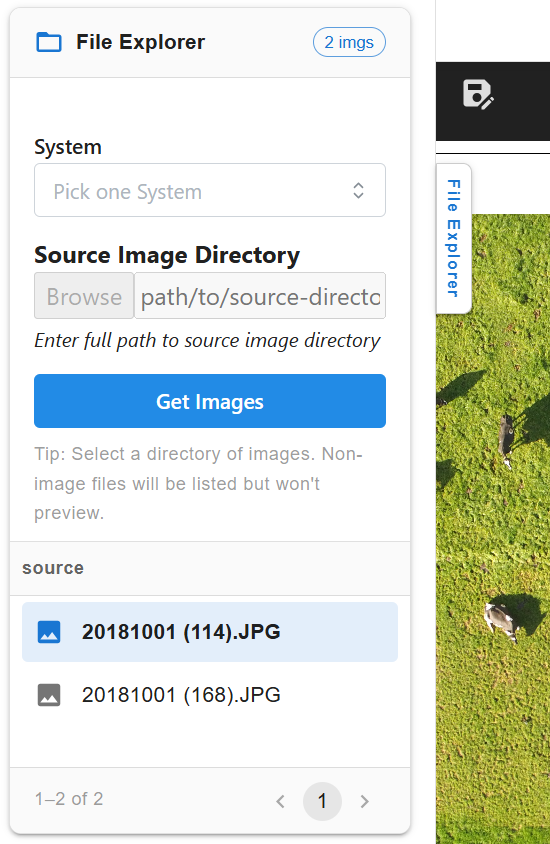
In the File Explorer, select a System from the dropdown and enter the full path to your source image directory in the Source Image Directory field. Click Get Images to load image previews. Click any filename in the list to open that image in the annotation canvas.
Step 2 — Interactive Image Segmentation
The Segmentation Workspace
The annotation canvas shifts away from traditional bounding-box layouts into a dedicated polygon and pixel-masking workflow. The interface provides several controls:
- Toolbar Core Utilities — icons at the top of the canvas for download, upload (import), save, and refresh.
- Confidence Thresholding — a slider on the right panel adjusts mask visibility and retention levels dynamically based on model-assisted proposals.
- Review Flagging — masks requiring secondary verification can be tagged with a Needs Review status. Custom flag names can also be added.
- Dynamic Mask Listing — the right panel keeps an active tally of polygon masks applied to the current image, grouped by label, with per-mask point counts, bounding boxes, and confidence scores.
- Filter by Label / Flag — click any label or flag chip in the right panel to filter the displayed masks.
The canvas toolbar (left to right): zoom in, zoom out, reset view, Smart Click (SAM3-assisted masking), bounding box draw mode, polygon draw mode, image mode, outline width selector, and clear all.
Drawing Masks Manually
- Switch to draw mode by selecting the pencil icon.
- Click on the canvas to place polygon points around an object.
- Click the first point (shown in green) to close the polygon and create the mask.
- Assign or confirm a label for the mask in the right panel.
SAM3 Segmentation-Assisted Annotation
Click the Smart Click tool (magic wand icon) in the toolbar to open the SAM3 configuration panel. Two modes are available:
Single Click mode — enter a label, then click on any object in the image. SAM3 auto-generates a segmentation mask for that object.
Text Prompt mode — enter one or more comma-separated class labels (e.g. cow, giraffe). SAM3 runs open-vocabulary detection across the full image and returns masks for all matching objects.
Both modes expose the following settings:
- Enable SAHI — toggles Slicing Aided Hyper Inference, which divides the image into overlapping tiles before running inference. Significantly improves detection of small or densely packed objects in large images.
- Crop Size (patch_size) — tile size in pixels when SAHI is enabled (e.g.
640). Smaller values catch finer details; larger values are faster. - Detection Confidence — minimum confidence score (0–1) a detection must reach to be kept. Raise to reduce false positives; lower to catch more candidates.
- Mask Precision — controls how closely the mask contour follows object boundaries (0–1). Higher values produce finer, more detailed outlines; lower values give smoother, simplified shapes.
Click Enter to run inference, or Exit to close without running.
Finishing Up
When annotation is complete, click the Save icon in the toolbar. A Save Annotations modal opens where you select a cluster (e.g. pitzer-tapis), enter a remote File Path for the output JSON, and toggle between COCO JSON and Default JSON formats. A live format preview is shown before saving. Click Save to write the file to the Tapis filesystem.
To export to your local machine instead, click the Download icon and select COCO JSON or Default JSON.
To load an existing annotation file, click the Import (upload) icon. Choose a cluster and either browse for a local file or enter a remote path. Toggle the format switch to match the file format (COCO JSON or Default JSON) and click Upload.